

Reporting the revenue forecast in Salesforce.com is vital information for predicting Sales, budgeting operational support and planning cash flow. The sales team is hard at work moving deals to close and staying on track while management is reviewing these deals to determine how viable and credible the forecast will be for the specific reporting period. Let’s take a deep dive into a simple illustration of how this gets done and what the components are of the forecast.
The deals, or Opportunities, as the standard name goes in Salesforce, are the records stored in the database that show how well a deal is progressing towards the expected close date and amount of the sale. Each deal has some standard fields that are used to reflect and calculate this important milestone. Here is a summary of these standard fields that help with the forecast report:
- Opportunity Name – the identifying name of the specific deal
- Opportunity Owner – the rep that is working the deal and owns its success
- Stage – the progress point of the deal (refer to last week’s article for more details)
- Opportunity Amount – how much the deal is worth in dollars
- Close Date – the date that the deal is expected to close and become a sale
- Probability – the percentage used of deals in a particular stage that close historically (refer to last week’s article)
- Forecast Category – the value assigned to a stage when reporting sales pipeline results
NOTE: If you didn’t read last week’s article, this would be a good time to refer back so that the calculations are clear as we present the reporting of opportunities below.
The critical computation for the forecast is related to the Opportunity Amount, the Stage, and the Probability. Because management continuously reviews the percentage of deals that close based on information gathered that is related to a “good” deal and a “not-so-good” deal, the probability represents what the likelihood is that a deal will close with the details of each input about the deal. Here is an example of a typical forecast report:
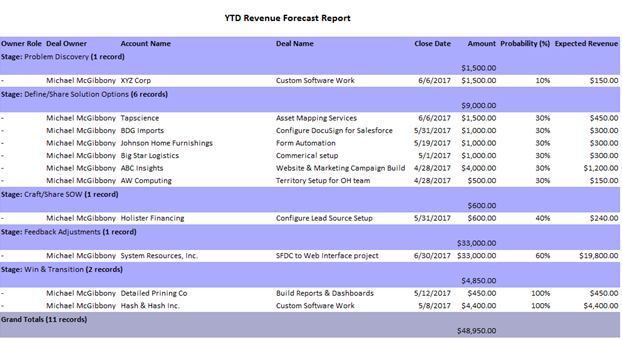
As you can see from the example, the Amount column represents the total expected revenue to be generated from the deals in the list while the Expected Revenue is related to which stage the deal is in and the probability associated with that stage based on historical outcomes. For example, the first deal in the report for XYZ Corp, shows a deal that is valued at $1,500 but because it is so early in its stage, the deal probability is only 10% based on experience. The basis of the 10% can be further adjusted if the parameters of this specific deal are not in line with what historical deals may have had too if they are vastly different from past deal parameters.
Let’s dive into parameters now. These parameters are custom defined attributes of a deal based on sales leadership’s knowledge of their product and services. Each stage has a set of specific parameters that must be articulated to a prospective customer to learn whether they are a true buyer.
Suppose we look at all the stages in another deal example. Looking at each stage below, we have a specific set of actions and information that must be captured by the rep from the prospect by stage to give credibility to the overall health a deal. Here is a table of what this might look like:
Stage – Prospecting
Parameters to learn in this stage:
- Reception to Elevator Pitch – pitch the deal
- Size of organization – how big is the org – are they the right “fit” for our product/service
- Has a compelling driver for product/service – what is the pain point that they are experiencing
- There is a project sponsor and budget – can they fund this project or get funding – what is the cost of doing nothing?
Stage – Discovery
Parameters to learn in this stage:
- Define current problem – size up the problem and the effect on the organization’s operation – what is the metric
- Where is the pain felt from the problem – which area of the organization is experiencing the problem
- What other options are being considered for the solution – competitors
Stage – Solution/Presentation
Parameters to learn in this stage:
- Share solution options and successes from them – present the solution and pricing
- Implementation timeline presented and solution demonstrated – how will the solution get implemented and how long will it take
- Feedback on demonstration – what is the reaction and next step from the prospect and the sponsors
Stage – Negotiate and Close
Parameters to complete in this stage:
- Submit final adjustments and contract for signing – any discounts, other terms and conditions to consider pushing the deal through
- Plan implementation – bring the players in for the implementation game plan
- Get documents signed and hand-off to production – ink the deal!
Each of these parameters for the stages in this example are key turning points (tipping points that take the deal to the next step/deal velocity) for the deal to progress and move forward. As each of these parameters are learned, completed, and evaluated for quality related to the history of similar opportunities, the probability is established based on the answers to each of the parameters. For example, if in stage Prospecting, it is learned that there is no funding for the deal, then the chances will be very low to zero that this deal will progress, so it would fall “outside” of the “normal” historical deal flow for this stage.
We invite your feedback and ideas to share related to the revenue forecast. Please contact us with your comments and questions.